import React from 'react';
import { PolarArea } from 'react-chartjs-2';
import { Chart, registerables } from 'chart.js';
Chart.register(...registerables); //注册极地图
const PolarChart = () => {
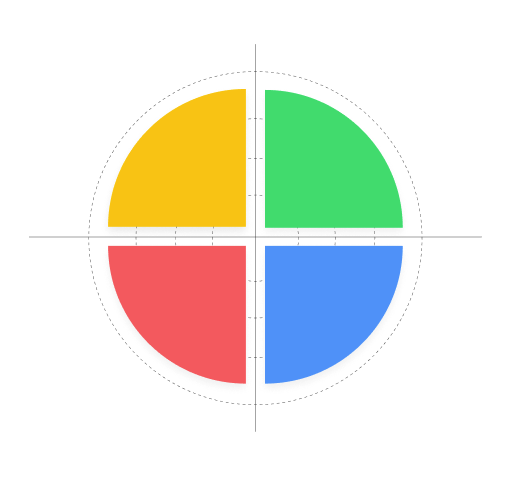
const data = {
labels: ['A', 'M', 'H', 'C'],
datasets: [
{
data: [1, 1, 1, 1],
borderWidth: [10, 10, 10, 10],
hoverBorderWidth: [1, 1, 1, 1],
backgroundColor: ['#4ade80', '#60a5fa', '#f87171', '#facc15'],
hoverBackgroundColor: ['#4ade80', '#60a5fa', '#f87171', '#facc15'],
},
],
};
const options = {
plugins: {
tooltip: { enabled: false }, //是否在hover时显示提示
legend: { display: false }, // 是否显示labels
},
scales: {
r: {
grid: { // 极地图刻度线的样式
borderDash: [5, 5],
color: 'rgba(0, 0, 0, 0.6)',
},
ticks: { // 刻度样式和间距
display: false,
max: 3,
min: 1,
stepSize: 0.8,
},
},
},
};
return (
<div className="relative">
<PolarArea data={data} options={options} />
{/* 横轴和纵轴用相对定位的方式实现 */}
<div className="left-50% top-0 height-325"></div>
<div className="top-50% left-0 width-325"></div>
</div>
);
};
export default PolarChart;
效果