
在微服务项目中,有很大一块就是服务治理。那么服务调用链路的治理就是其中一项。为了方便切换链路追踪的实现,我们主要选择实现opentracing的方案。spring cloud提供了sleuth组件,但是我们更倾向用jaeger来实现。
jaeger架构如下

这里我们以spring boot 集成jeager
环境:
- spring boot:2.5.3
- opentracing-spring-jaeger-cloud-starter:3.3.1
dependencies
<dependencies>
    <dependency>
        <groupId>org.projectlombok</groupId>
        <artifactId>lombok</artifactId>
    </dependency>
    <dependency>
        <groupId>org.springframework.boot</groupId>
        <artifactId>spring-boot-starter-web</artifactId>
    </dependency>
    <dependency>
        <groupId>org.springframework.cloud</groupId>
        <artifactId>spring-cloud-starter-openfeign</artifactId>
    </dependency>
    <dependency>
        <groupId>io.opentracing.contrib</groupId>
        <artifactId>opentracing-spring-jaeger-cloud-starter</artifactId>
        <version>3.3.1</version>
    </dependency>
</dependencies>
注意:opentracing-spring-jaeger-cloud-starter不支持最新版本的spring-cloud-starter-openfeign。spring-cloud-starter-openfeign中的LoadBalancerFeignClient被移除了。所以我们需要自己创建下。
package org.springframework.cloud.openfeign.ribbon;

import feign.Client;
import org.springframework.cloud.netflix.ribbon.SpringClientFactory;

public class LoadBalancerFeignClient {
    public LoadBalancerFeignClient(Client delegate, CachingSpringLoadBalancerFactory lbClientFactory, SpringClientFactory clientFactory) {
        throw new UnsupportedOperationException();
    }

    public Client getDelegate() {
        throw new UnsupportedOperationException();
    }
}
package org.springframework.cloud.openfeign.ribbon;

public class CachingSpringLoadBalancerFactory {
}
package org.springframework.cloud.netflix.ribbon;

public class SpringClientFactory {
}
根据官方文档,我们以jaeger-all-in-one 作为我们测试的收集端
docker run -d --name jaeger \
  -e COLLECTOR_ZIPKIN_HOST_PORT=:9411 \
  -p 5775:5775/udp \
  -p 6831:6831/udp \
  -p 6832:6832/udp \
  -p 5778:5778 \
  -p 16686:16686 \
  -p 14268:14268 \
  -p 14250:14250 \
  -p 9411:9411 \
  jaegertracing/all-in-one:1.27
配置jeager的相关参数
opentracing.jaeger.enabled=true
opentracing.jaeger.const-sampler.decision=true
opentracing.jaeger.probabilistic-sampler.sampling-rate=1
opentracing.jaeger.service-name=jeager-app
opentracing.jaeger.udp-sender.host=localhost
opentracing.jaeger.udp-sender.port=6831
opentracing.jaeger.log-spans=true
jeager-ui地址 http://localhost:16686/
服务起起来之后,界面如下
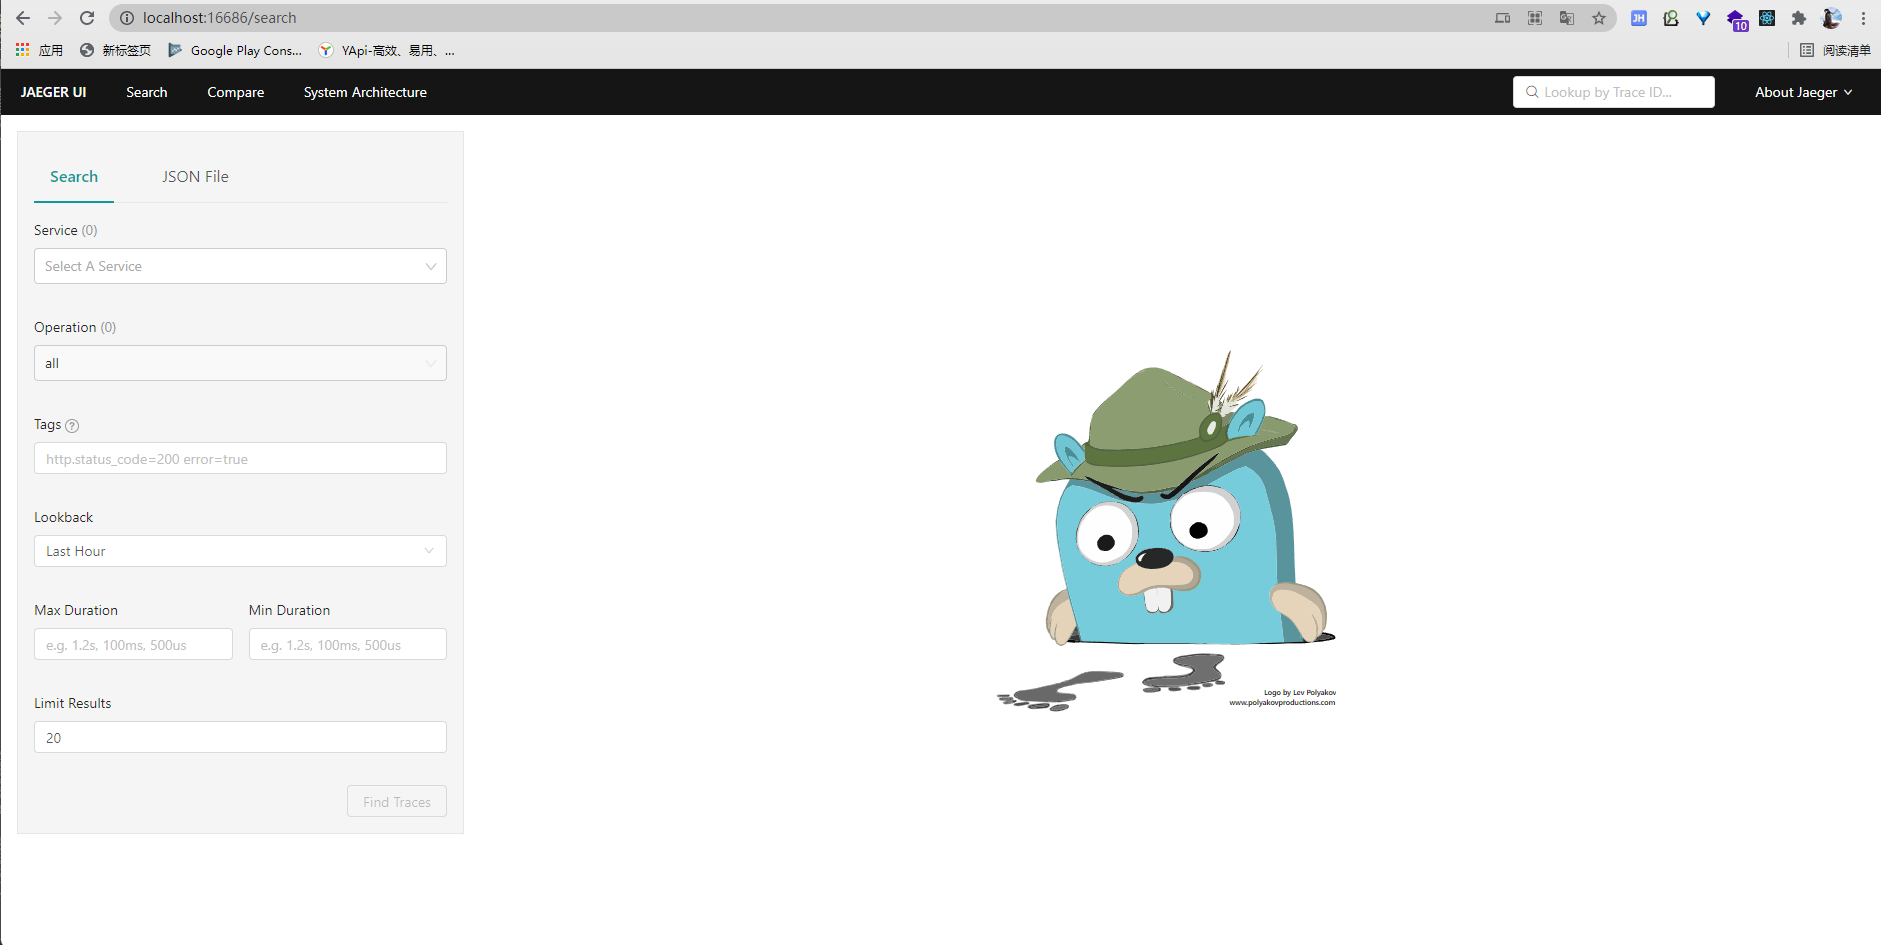
这个时候,界面上空空如也。我们执行一次请求,可以看到上传的链路信息
点击一条记录可以看到如下调用链路信息。
